Five Numbers on Your Operations Dashboard That Deserve Less Trust Than They Get
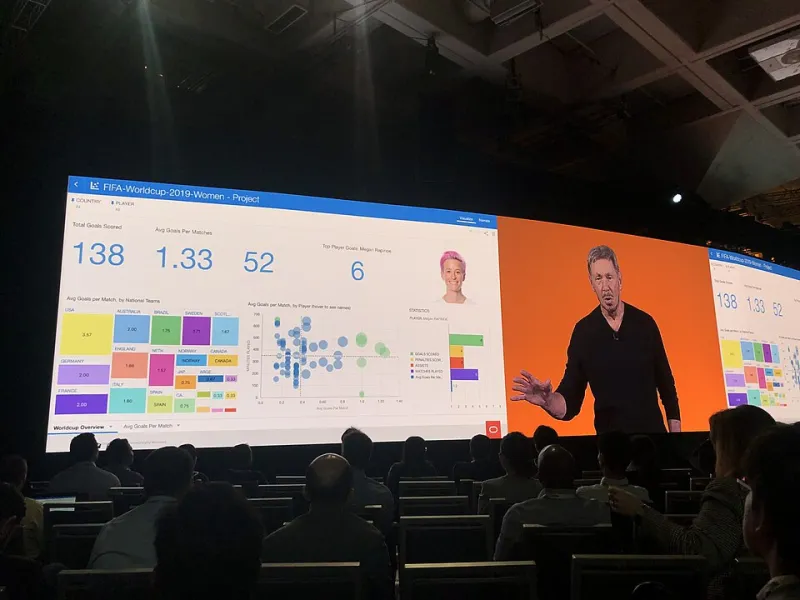
Photo: GeneralAB13, CC BY-SA 4.0, via Wikimedia Commons
Every operations leader has had the experience: the dashboard is green, the quarterly review is celebratory, and yet the P&L tells a different story. The disconnect is rarely fraud and rarely incompetence. It is measurement drift — metrics that were reasonable proxies a decade ago, now optimized by teams, vendors, and systems in ways that sever the link between the number and the health of the business.
Here are five of the most trusted metrics in US operations, and why each one deserves skepticism.
1. On-Time Delivery
The problem: OTD is the most gameable number in logistics. The date being measured is frequently the date the system promised, not the date the customer needed — and nothing stops an organization from quietly loosening promise dates until performance looks excellent. A 97% OTD built on ten-day promises is worse than an 88% OTD built on five-day promises, but the dashboard cannot tell you that. Worse, carriers and 3PLs report OTD against their own event timestamps, and a shipment marked "delivered" at a dock at 11:58 PM on the deadline counts the same as one in a customer's hands.
Ask instead: Promise-date integrity and customer-need attainment. Are we hitting the dates we quote customers at order time, and how do those quoted dates compare to what the market offers? Measure the promise, not the performance against the promise.
2. Inventory Turns
The problem: Turns reward leanness without pricing fragility. A team can push turns higher by cutting safety stock, and the dashboard will celebrate for two or three quarters — right up until a stockout costs a key account, an expedite invoice, or a production line. Turns also treat inventory as uniformly good or bad, ignoring that $2 million of fast-moving finished goods and $2 million of obsolete components are not the same asset.
Ask instead: Segment inventory by velocity and age, and pair turns with stockout rate and lost-sales events. Healthy operations run lean where demand is predictable and buffered where it is not. A single blended turns figure erases exactly the distinction that matters.
3. Cost Per Shipment
The problem: Cost per shipment is a rate-card metric masquerading as an efficiency metric. It rewards consolidation that slows delivery, penalizes mode shifts that customers would happily pay for, and ignores the accessorial and invoice-variance layer where mid-market shippers actually lose money. It also creates perverse incentives: the cheapest shipment is frequently the one that generates the costliest downstream problem — a damaged delivery, a missed appointment, an angry account manager.
Ask instead: Total landed cost per order, including accessorials, expedites, claims, and the labor spent fixing failures. And track cost against the service commitment actually sold, so the number reflects the trade-off you chose rather than the one your freight bill chose for you.
4. Forecast Accuracy
The problem: Forecast accuracy is measured at the level where it flatters the forecaster — usually aggregate, monthly, and in units rather than dollars or margin. A forecast can be 94% accurate in total while being catastrophically wrong on the specific SKUs and regions that drive revenue. Teams also learn to forecast conservatively, then celebrate "beating" the number, which corrupts the planning cycle downstream.
Ask instead: Forecast error at the SKU-location level, weighted by margin, with bias tracked separately from variance. Bias — the consistent tendency to over- or under-forecast — is the more diagnostic number, because it reveals incentive problems that variance alone will hide.
5. Perfect Order Rate
The problem: Perfect order rate sounds like the antidote to everything above, and it is better than most metrics. But it is usually a composite of components already gamed — on-time, in-full, damage-free, correctly invoiced — and multiplying gamed inputs produces a confidently wrong output. It also averages away concentration: a 96% perfect order rate that hides the fact that your three largest customers experience 85% is a number that will cost you a renewal before it costs you a point on the dashboard.
Ask instead: Perfect order rate segmented by customer tier and by account. The metric only earns trust when the distribution is visible, because the customers who matter most are precisely the ones a blended average conceals.
The Pattern Behind All Five
Notice what the misleading metrics share: each measures performance against an internal standard that the organization itself controls — the promise date, the forecast, the rate card. Any metric the measured party can influence by moving the target will drift toward flattery. The corrective is always the same: anchor measurement to something external and harder to negotiate — customer expectations, margin, market benchmarks — and insist on distributions, not averages, because the tail of the distribution is where the business is actually won or lost.
Dashboards do not lie, exactly. They just answer the questions they were built to answer. The work is making sure someone is asking better ones.